- Categories:
2024 Online Sales Trends: Black Friday, Small Business Saturday, and Cyber Monday
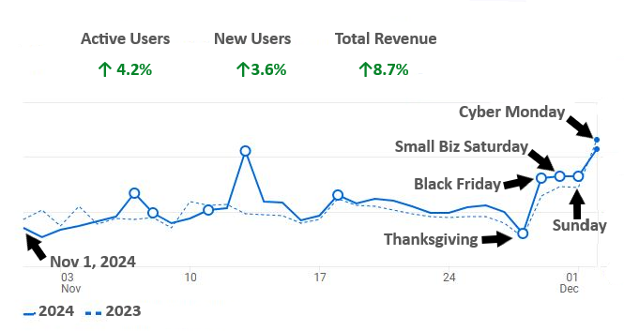
Here are year-over-year results that compare Google Analytics online sales revenue and traffic data for all websites hosted by the IndieCommerce platform.
The results are for Friday, November 1, 2024–Monday, December 2, 2024, as compared to Friday, October 27, 2023–Monday, November 27, 2023.
This comparative graph aligns the days of the week for the Thanksgiving holiday and Cyber Weekend, giving a more accurate 2023 baseline for comparison purposes.

The solid blue line represents 2024 sales revenue, and the dash line represents 2023.
Some additional sales revenue points are:
-
Overall sales revenue for IndieCommerce 1.0 and 2.0 was up ↑8.7%
-
The number of new users on the 1.0 and 2.0 platforms were up ↑3.9%
-
The number of active users on IndieCommerce websites were up ↑4.7%
-
Thanksgiving, November 28, was up ↑13% vs 2023 (low overall sales volume as usual)
-
Black Friday, November 29, was up ↑24.6% vs 2023
-
Small Biz Saturday, November 30, was up ↑13.2% vs 2023
-
Sunday, December 1, was up ↑14% vs 2023
-
Cyber Monday was down ↓7.7% vs 2023
Note: The anomalous sales spike on November 13, 2024 was the result of store(s) having special sales event(s).
These sales results are based on aggregate data that has been collected and reported to us by Google Analytics (GA4) across the entire IndieCommerce 1.0 and 2.0 platforms. We use this data to show sales trends across our platform.

